Indicator Gauge Icon Legend
Legend Colors
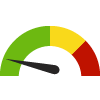
Red is bad, green is good, blue is not statistically different/neutral.
Compared to Distribution
 the value is in the best half of communities.
 the value is in the 2nd worst quarter of communities.
 the value is in the worst quarter of communities.
Compared to Target
 meets target;
  does not meet target.
Compared to a Single Value
 lower than the comparison value;
 higher than the comparison value;
 not statistically different from comparison value.
Trend

 non-significant change over time;
 significant change over time;
  no change over time.
Compared to Prior Value
 higher than the previous measurement period;
 lower than the previous measurement period;
 no statistically different change from previous measurement period.
 Significantly better than the overall value
 Significantly worse than the overall value
 No significant difference with the overall value
 No data on significance available
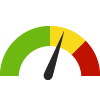
Children with Acanthosis Nigricans
Measurement Period: 2022-2023
This indicator is archived and is no longer being updated. Click to learn more
Acanthosis nigricans (AN) is a skin marker associated with high insulin levels and insulin resistance and is considered a risk factor for type 2 diabetes and other chronic diseases. Insulin is produced by an organ called the pancreas. Insulin is important because it helps "carry" glucose to cells in the body. Glucose is the energy that cells need in order for them to function. High insulin levels indicate that the pancreas may be producing too much insulin, ant through time, can stop producing enough insulin to take glucose to the cells in the body.
Why is this important?
The data shown was collected by the Texas Risk Assessment for Type 2 Diabetes in Children which is a state-mandated program that helps assess children who may be at high risk to develop type 2 diabetes. This assessment is conducted by certified individuals in public and private schools during vision/hearing and scoliosis screenings. Children enrolled in 1st, 3rd, 5th and 7th grades are assessed for high insulin levels. Risk assessments are issued to the parents of these children, alerting parents of the child's risk factors and encouraging further evaluation form a health professional. Because of the increasingly alarming rates of children developing type 2 diabetes, AN assessments are important and can help identify children with high insulin levels who may be at-risk for developing the disease. Becoming aware of and understanding what the risk factors suggest can stimulate the changes necessary to prevent or delay future health problems for children who may be at risk of developing type 2 diabetes and/or other conditions.
Cameron, Hidalgo, Starr, & Willacy counties.
8.0%
Percent of children
Source:
UTRGV Border Health Office
Measurement period: 2022-2023
Maintained by: Unidos Contra la Diabetes
Last update: January 2024
Measurement period: 2022-2023
Maintained by: Unidos Contra la Diabetes
Last update: January 2024
Compared to
Graph Selections

Data Source
- UTRGV Border Health Office
Maintained By: Unidos Contra la Diabetes
Filed under: Health / Children's Health, Health / Diabetes, Health / Prevention & Safety, Children, Teens