
Indicator Gauge Icon Legend
Legend Colors
Red is bad, green is good, blue is not statistically different/neutral.
Compared to Distribution
 the value is in the best half of communities.
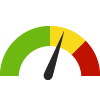 the value is in the 2nd worst quarter of communities.
 the value is in the worst quarter of communities.
Compared to Target
 meets target;
  does not meet target.
Compared to a Single Value
 lower than the comparison value;
 higher than the comparison value;
 not statistically different from comparison value.
Trend

 non-significant change over time;
 significant change over time;
  no change over time.
Compared to Prior Value
 higher than the previous measurement period;
 lower than the previous measurement period;
 no statistically different change from previous measurement period.
 Significantly better than the overall value
 Significantly worse than the overall value
 No significant difference with the overall value
 No data on significance available
Adults who are Overweight (Clinic D)
This indicator is archived and is no longer being updated. Click to learn more
This indicator shows the percentage of patients aged 18 and older with a Body Mass Index (BMI) >=25 < 30 in the reporting period. A BMI between 25 and 29.9 is considered overweight.
Why is this important?
The percentage of overweight adults is an indicator of the overall health and lifestyle of a community. Being overweight affects quality of life and puts individuals at risk for developing many diseases, especially heart disease, stroke, diabetes, and cancer. Losing weight helps to prevent and control these diseases. Being overweight also carries significant economic costs due to increased healthcare spending and lost earnings.
Cameron, Hidalgo, Starr, & Willacy counties.
11.5%
Source:
San Benito
Measurement period: 2019
Maintained by: Unidos Contra la Diabetes
Last update: October 2020
Measurement period: 2019
Maintained by: Unidos Contra la Diabetes
Last update: October 2020
Compared to

Data Source
- San Benito
Maintained By: Unidos Contra la Diabetes
Filed under: Health / Physical Activity, Health Status, Adults