
On this page
Health / Disabilities Indicator
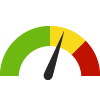
Veterans with a Disability
43%
Location: 48215024208
Period:
2019-2023
Show:
Rate

Higher than the Hidalgo, TX County Value (36.4%)

Increasing over time
What does it measure?
This indicator shows the percentage of American veterans 18 years and over that are limited in any activities because of physical, mental, or emotional problems.
Why is this important?
Every year, military personnel leave active duty and return to civilian jobs. Recent veterans report high rates of service-connected disabilities. People with a disability have difficulties performing activities due to a physical, mental, and/or emotional condition. The extent to which a person is limited by a disability is heavily dependent on the social and physical environment in which he or she lives. Without sufficient accommodations, people with disabilities may have difficulties living independently.
There is often a strong relationship between disability status and reported health status, and many individuals with disabilities require more specialized health care and assistance as a result of the disability. Several federal agencies use information on the size, distribution, and needs of the disabled population in order to develop policies, distribute funds, and develop programs for individuals with disabilities.
Changes Over Time
Location

Click Play button to show timeline.
| Census Tract | Period | Percent | |
|---|---|---|---|
Populations
Demographics:
- This location has detailed demographic information available: View the demographic details in a new tab.
Further Resources
Source
Data Source
American Community Survey 5-YearNote: This source uses Zip Code Tabulation Areas (ZCTAs) for its Zip Code data. Learn more
More Details
Technical Note
The U.S. Census Bureau calculates 90% confidence intervals for American Community Survey estimates. Use caution when interpreting values with wide confidence intervals. Confidence intervals that are farther away from estimates in either direction indicate uncertainty due to small survey sample sizes. The U.S. Census Bureau does not recommend comparing overlapping 5-year periods since much of the data in each estimate are the same. Use caution when comparing estimates for census tracts over time as these geographies are redefined with each decennial census according to population changes.
Numerator and Denominator
110
Last Update
2025-02-09Maintained by
Conduent Healthy Communities Institute
Filed Under
Health / Disabilities, Physical Determinants of Health, Veterans, Adults, People with Disabilities
This indicator is archived and is no longer being updated. Click to learn more
Indicator Gauge Icon Legend
Legend Colors
Redis bad, Greenis good, Blueis not statistically different/neutral.
Compared to Distribution
 the value is in the best half of communities.
 the value is in the 2nd worst quarter of communities.
 the value is in the worst quarter of communities.
Compared to Target
 meets target;
  does not meet target.
Compared to a Single Value
 lower than the comparison value;
 higher than the comparison value;
 not statistically different from comparison value.
Trend

 non-significant change over time;

 significant change over time;
 no change over time.
Compared to Prior Value
 higher than the previous measurement period;
 lower than the previous measurement period;
 no statistically different change from previous measurement period.
 Different than the overall value
 Similar to the overall value.
 No confidence interval data available.